Motivation
Chapters 1 and 2 treated \hat\beta = (X^\top X)^{-1}X^\top y as a purely algebraic object: given the design matrix X and the observed response vector y, the least-squares estimator is a fixed formula and the loss L(\beta) = \lVert y - X\beta \rVert^2 is a deterministic surface. That framing is enough to motivate the mechanics, but it papers over the most important fact about marketing data: weekly sales figures are noisy. The same media schedule run in two consecutive quarters will produce different revenue outcomes — different weather, different competitor promotions, different consumer sentiment. y is not a fixed signal; it is a single realization of a random process.
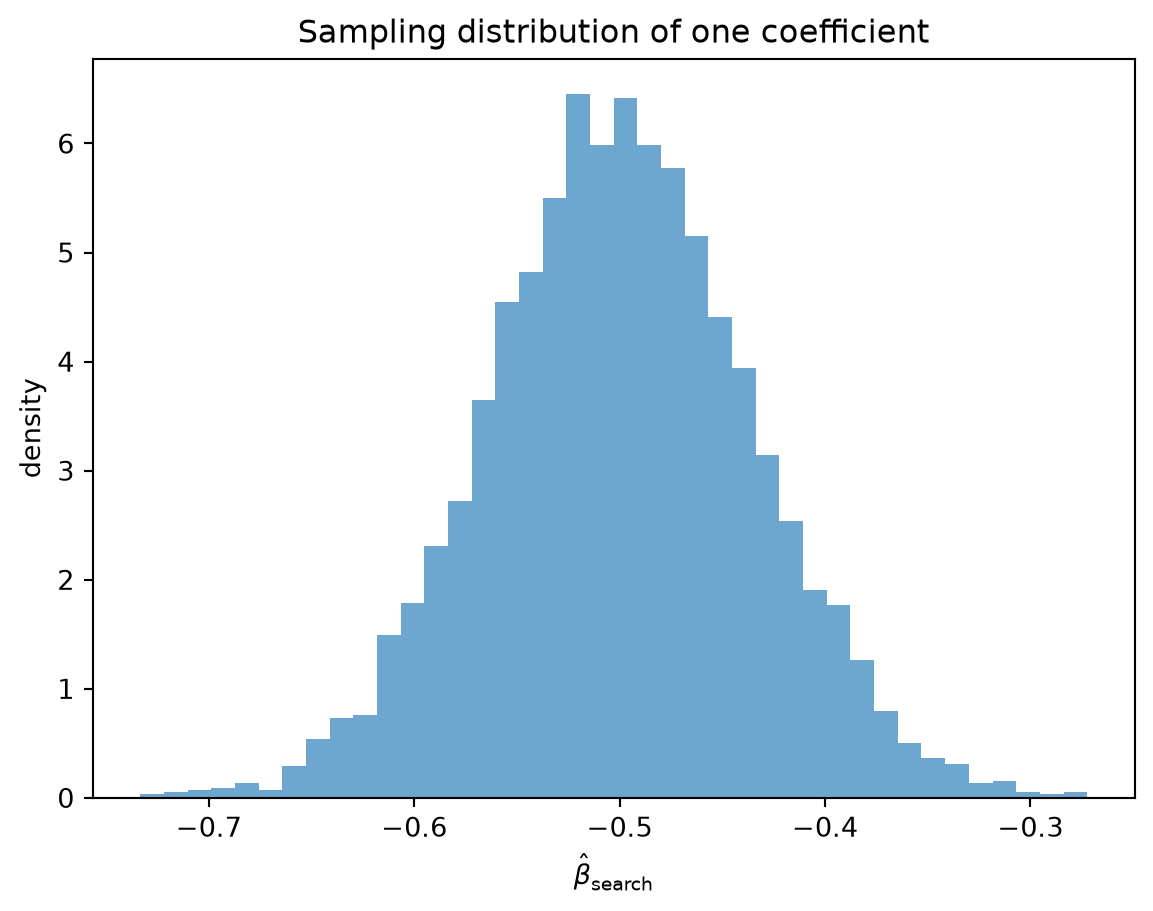
“If you reran the same campaign, you’d get different sales — so how much of \hat\beta is signal, and how much is luck?”
Probability theory is the language for making that question precise. We model the observed response as
y = X\beta + \varepsilon, \qquad \varepsilon \sim \mathcal{N}(0, \sigma^2 I),
where \beta is a fixed but unknown parameter vector and \varepsilon is a random draw. Making y random immediately gives \hat\beta a sampling distribution — it becomes a random vector in its own right, and we can ask for its mean, covariance, and the probability that it deviates from the truth by more than any given amount. The probabilistic framing also reinterprets the work of Chapter 2: minimizing L(\beta) is equivalent to maximizing the Gaussian log-likelihood, so least squares is maximum likelihood estimation in disguise.
This chapter builds the probabilistic toolkit in the order it is needed: random vectors and covariance matrices, probability distributions and the multivariate normal, conditioning, likelihood and MLE, the law of large numbers and the central limit theorem, and Bayes’ theorem. That ladder carries directly into Part II, where we place a prior on \beta and work with a full posterior distribution over media effects, and into Part III, where Monte Carlo methods make high-dimensional posteriors tractable (Casella and Berger 2002).
Theory & Proofs
Random variables, expectation, and covariance
A random variable X is a function assigning a numerical value to each outcome of a random experiment; for our purposes it is described by a density p(x) (continuous case) or a probability mass function (discrete case). Its expectation is the average value weighted by probability, \mathbb{E}[X] = \int x\,p(x)\,dx, and its variance measures spread about that average, \operatorname{Var}(X) = \mathbb{E}\big[(X - \mathbb{E}[X])^2\big]. Expectation is linear: for constants a, b and random variables X, Y, \mathbb{E}[aX + bY] = a\,\mathbb{E}[X] + b\,\mathbb{E}[Y], regardless of any dependence between X and Y.
Marketing data is multivariate — a vector of weekly outcomes, a vector of media spends — so we work with random vectors. For a random vector w \in \mathbb{R}^m the analogue of variance is the covariance matrix
\operatorname{Cov}(w) = \mathbb{E}\big[(w - \mathbb{E}w)(w - \mathbb{E}w)^\top\big],
whose (i,j) entry is the covariance between coordinates w_i and w_j. It is symmetric and positive semidefinite: for any fixed c, c^\top \operatorname{Cov}(w)\, c = \operatorname{Var}(c^\top w) \ge 0. The single most useful fact about it is how it behaves under linear maps.
Proposition. For a fixed matrix A and fixed vector b, \operatorname{Cov}(Aw + b) = A\,\operatorname{Cov}(w)\,A^\top.
Proof. Let \mu = \mathbb{E}w. By linearity of expectation \mathbb{E}[Aw + b] = A\mu + b, so the centered vector is (Aw + b) - (A\mu + b) = A(w - \mu). Therefore
\begin{aligned}
\operatorname{Cov}(Aw + b)
&= \mathbb{E}\big[A(w - \mu)(w - \mu)^\top A^\top\big] && \text{(centered outer product)} \\
&= A\,\mathbb{E}\big[(w - \mu)(w - \mu)^\top\big]\,A^\top && \text{($A$ constant)} \\
&= A\,\operatorname{Cov}(w)\,A^\top .
\end{aligned}
\blacksquare
This is exactly the identity that justified Chapter 1’s Cholesky sampling: if z has \operatorname{Cov}(z) = I and \Sigma = LL^\top, then \operatorname{Cov}(Lz) = L\,I\,L^\top = LL^\top = \Sigma, so Lz has the desired correlation structure.
The distributions we will need
The star of this chapter is the Gaussian (normal) distribution \mathcal{N}(\mu, \sigma^2), with one-dimensional density
p(x) = \frac{1}{\sqrt{2\pi\sigma^2}} \exp\!\left(-\frac{(x - \mu)^2}{2\sigma^2}\right).
Its parameters are exactly its mean \mu and variance \sigma^2, and it is the assumed law of the noise term \varepsilon in our model y = X\beta + \varepsilon. We will lean on it repeatedly, both as a noise model and, in Part II, as a prior on \beta.
A handful of other distributions recur in marketing mix modeling (Casella and Berger 2002). The Bernoulli distribution models a single binary outcome — a user who converted or did not — and the Binomial counts the conversions among many independent such users. The Poisson distribution models counts of events over a fixed window, such as the number of store visits or website sessions in a week. The Gamma distribution governs positive continuous quantities and will later serve as a prior for a variance parameter or for a non-negative spend coefficient. The half-normal distribution — the absolute value of a mean-zero Gaussian, with density p(x) \propto \exp(-x^2 / 2\sigma^2) for x \ge 0 and mean \sigma\sqrt{2/\pi} — places all of its mass on the non-negative half-line, and will serve repeatedly as a prior for quantities that cannot be negative, such as a scale parameter or a media coefficient constrained to drive sales upward. We state these here and call on them as needed rather than developing each in full.
Joint, conditional, and the regression model
When several random variables vary together, their joint density p(u, v) describes the probability of each combination. From it we recover the marginal density of one variable by integrating out the other, p(u) = \int p(u, v)\,dv, and the conditional density of u given a known value of v by renormalizing, p(u \mid v) = p(u, v) / p(v). The variables are independent when the joint factors into marginals, p(u, v) = p(u)\,p(v), equivalently when conditioning changes nothing, p(u \mid v) = p(u).
Regression is conditioning made operational: we do not model the marginal distribution of sales, but the distribution of y given the design X and parameters \beta, written y \mid X, \beta. Under y = X\beta + \varepsilon with \varepsilon \sim \mathcal{N}(0, \sigma^2 I), the matrix X\beta is a constant once we condition on X and \beta, so the mean is
\mathbb{E}[y] = \mathbb{E}[X\beta + \varepsilon] = X\beta + \mathbb{E}[\varepsilon] = X\beta,
using linearity and \mathbb{E}[\varepsilon] = 0. For the covariance, a constant shift does not change spread, so the rung-1 identity gives
\operatorname{Cov}(y) = \operatorname{Cov}(X\beta + \varepsilon) = \operatorname{Cov}(\varepsilon) = \sigma^2 I.
The off-diagonal zeros in \sigma^2 I encode independence of the noise across rows — the assumption that the weeks do not influence one another’s random shocks. It is a strong assumption, convenient for now and one we will relax when we model autocorrelated or seasonal errors.
The multivariate normal
The Gaussian generalizes to a random vector w \in \mathbb{R}^m with mean \mu and covariance \Sigma \succ 0. Its density is
p(w) = (2\pi)^{-m/2}\,(\det\Sigma)^{-1/2}\,\exp\!\Big(-\tfrac12 (w - \mu)^\top \Sigma^{-1}(w - \mu)\Big).
Two structural pieces deserve attention. The quadratic form (w - \mu)^\top \Sigma^{-1}(w - \mu) is the squared Mahalanobis distance of w from \mu: it measures how many “standard deviations” w sits from the mean, but unlike a plain Euclidean distance it accounts for correlation and unequal variances by stretching space through \Sigma^{-1}. Directions in which w varies a lot are downweighted; tightly constrained directions are amplified. The scalar \det\Sigma is the normalizing volume — the factor (\det\Sigma)^{-1/2} rescales the density so it integrates to one, just as 1/\sqrt{2\pi\sigma^2} does in one dimension.
The cleanest way to build such a vector is to push a standard Gaussian through an affine map, which connects directly to Chapter 1’s Cholesky factorization.
Proposition. If z \sim \mathcal{N}(0, I) and w = \mu + Lz, then \mathbb{E}[w] = \mu and \operatorname{Cov}(w) = LL^\top. In particular, with \Sigma = LL^\top (the Chapter 1 Cholesky factor), w \sim \mathcal{N}(\mu, \Sigma).
Proof.
Mean. By linearity of expectation,
\mathbb{E}[w] = \mathbb{E}[\mu + Lz] = \mu + L\,\mathbb{E}[z] = \mu \qquad (\mathbb{E}[z] = 0).
Covariance. A constant shift does not change spread, so the rung-1 identity \operatorname{Cov}(Aw + b) = A\,\operatorname{Cov}(w)\,A^\top gives
\operatorname{Cov}(w) = \operatorname{Cov}(\mu + Lz) = L\,\operatorname{Cov}(z)\,L^\top = L\,I\,L^\top = LL^\top \qquad (\operatorname{Cov}(z) = I).
With \Sigma = LL^\top this is exactly \Sigma. \blacksquare
That the affine image of a Gaussian is again Gaussian — not merely some distribution with the matched mean and covariance — is the standard closure property of the normal family, which we take as given and cite (Casella and Berger 2002). Applied to our model, y = X\beta + \varepsilon is an affine map of the Gaussian noise \varepsilon \sim \mathcal{N}(0, \sigma^2 I), so y \sim \mathcal{N}(X\beta, \sigma^2 I) — the regression mean and covariance of rung 3, now upgraded to a full distributional statement.
Likelihood and the Gaussian MLE
With the distribution of y in hand we can ask which parameters best explain the data. The likelihood \mathcal{L}(\beta, \sigma^2) = p(y \mid \beta, \sigma^2) is the model density read as a function of the parameters with the observed data y held fixed, and the log-likelihood is \ell = \log\mathcal{L}. For y \sim \mathcal{N}(X\beta, \sigma^2 I) — equivalently a product of n independent Gaussians, or the multivariate density with \Sigma = \sigma^2 I so that \det\Sigma = (\sigma^2)^n and \Sigma^{-1} = \sigma^{-2}I — the density is
\mathcal{L}(\beta, \sigma^2) = (2\pi\sigma^2)^{-n/2}\,\exp\!\Big(-\frac{1}{2\sigma^2}\lVert y - X\beta\rVert^2\Big).
Taking logs turns the product into a sum and the exponential into its argument:
\ell(\beta, \sigma^2) = -\frac{n}{2}\log(2\pi\sigma^2) - \frac{1}{2\sigma^2}\lVert y - X\beta\rVert^2 .
Theorem (Gaussian MLE = least squares). For any fixed \sigma^2 > 0, the value of \beta maximizing \ell(\beta, \sigma^2) is the least-squares solution: it solves the normal equations X^\top X\hat\beta = X^\top y.
Proof. In \ell the first term -\frac{n}{2}\log(2\pi\sigma^2) is free of \beta, so only -\frac{1}{2\sigma^2}\lVert y - X\beta\rVert^2 depends on \beta. Because \frac{1}{2\sigma^2} > 0 is a positive constant, maximizing \ell over \beta is equivalent to minimizing \lVert y - X\beta\rVert^2 — the exact least-squares objective L(\beta) of Chapters 1–2. Differentiating, \nabla_\beta\ell = \frac{1}{\sigma^2}X^\top(y - X\beta), and setting this to zero gives
X^\top(y - X\hat\beta) = 0 \quad\Longleftrightarrow\quad X^\top X\hat\beta = X^\top y,
the normal equations. Under full column rank X^\top X \succ 0 (Chapter 1), so this solution is unique; and the objective is convex, its Hessian \nabla^2 L = 2X^\top X \succeq 0 (Chapter 2), so the stationary point is the global maximizer of \ell. \blacksquare
The curvature of \ell in \beta also quantifies how precisely \beta is determined. The Fisher information for \beta — the negative expected Hessian of \ell — is \mathcal{I}(\beta) = X^\top X / \sigma^2, so the MLE’s sampling covariance scales like \sigma^2 (X^\top X)^{-1}. This is the probabilistic restatement of Chapter 1’s conditioning story: collinear media channels make X^\top X near-singular (small eigenvalues, large condition number \kappa(X)), so \sigma^2(X^\top X)^{-1} blows up and \hat\beta is imprecise — ill-conditioning and statistical imprecision are two views of the same matrix.
Law of large numbers and the central limit theorem
Two elementary tail bounds drive everything that follows. Markov’s inequality states that for a non-negative random variable Y and any a > 0, \Pr(Y \ge a) \le \mathbb{E}[Y]/a. Applying it to (Y - \mathbb{E}Y)^2 with a = \epsilon^2 yields Chebyshev’s inequality,
\Pr(|Y - \mathbb{E}Y| \ge \epsilon) \le \frac{\operatorname{Var}(Y)}{\epsilon^2},
which says that a random variable rarely strays many standard deviations from its mean. Chebyshev is the whole engine of the law of large numbers.
Theorem (Weak LLN). Let X_1,\dots,X_n be i.i.d. with mean \mu and finite variance \sigma^2. Then for every \epsilon > 0, \Pr(|\bar X_n - \mu| \ge \epsilon) \to 0 as n \to \infty.
Proof. By linearity, \mathbb{E}[\bar X_n] = \frac{1}{n}\sum_i \mathbb{E}[X_i] = \mu, so \bar X_n is centered at the target. By independence the variances add, and the constant \frac{1}{n} pulls out squared:
\operatorname{Var}(\bar X_n) = \frac{1}{n^2}\sum_{i=1}^n \operatorname{Var}(X_i) = \frac{n\sigma^2}{n^2} = \frac{\sigma^2}{n}.
Applying Chebyshev’s inequality to \bar X_n gives
\Pr(|\bar X_n - \mu| \ge \epsilon) \le \frac{\operatorname{Var}(\bar X_n)}{\epsilon^2} = \frac{\sigma^2}{n\epsilon^2} \xrightarrow[n\to\infty]{} 0 . \qquad \blacksquare
The variance shrinks like 1/n, so the sample mean concentrates on \mu. The law tells us that \bar X_n converges; the central limit theorem tells us how fast and with what shape. After rescaling by \sqrt{n} the fluctuations stabilize to a Gaussian:
\sqrt{n}\,(\bar X_n - \mu) \ \xrightarrow{d}\ \mathcal{N}(0, \sigma^2),
for any i.i.d. sample with finite variance, regardless of the distribution of the X_i (Casella and Berger 2002; Wasserman 2004).
These two results justify much of what comes later. The LLN is the license for Monte-Carlo estimation: an average of many simulated draws converges to the expectation it estimates, which is exactly how Part III approximates posterior means, variances, and other integrals that have no closed form. The CLT does double duty: it explains why a Gaussian noise model is so often reasonable — observed noise is typically the aggregate of many small, independent shocks — and it tells us that the sampling distribution of an estimator like \hat\beta is approximately normal, which is the basis for the standard errors and confidence statements of uncertainty quantification.
Bayes’ theorem
The likelihood of rung 5 scores parameters against data; Bayes’ theorem turns that score into an updated belief. Writing \beta for parameters and y for data, the conditional-probability form is
p(\beta \mid y) = \frac{p(y \mid \beta)\,p(\beta)}{p(y)},
and, because the denominator does not depend on \beta, the proportional (unnormalized) form is
p(\beta \mid y) \ \propto\ \underbrace{p(y \mid \beta)}_{\text{likelihood (rung 5)}}\ \times\ \underbrace{p(\beta)}_{\text{prior}} ,
with p(y) = \int p(y \mid \beta)\,p(\beta)\,d\beta the normalizing evidence. Each piece has a plain reading: the prior p(\beta) is our belief about \beta before seeing the data; the likelihood p(y \mid \beta) is exactly the rung-5 object, the data density read as a function of \beta; and the posterior p(\beta \mid y) is the belief about \beta updated by the data.
This is a genuine departure from maximum likelihood. Where the MLE returns a single point estimate \hat\beta — the parameter that best explains the data — the Bayesian posterior is a full distribution over \beta. It answers the Motivation’s question of how much of an apparent effect is signal versus luck not with one number but with the spread of plausible \beta values, so the width of the posterior is the uncertainty. Actually computing that posterior — conjugate forms when they exist, and MCMC when no closed form does — is the work of Parts II and III.
Worked Examples
Example: the Gaussian MLE is the least-squares fit
We return to the three-week, two-channel design of Chapter 2 and view it through the likelihood. Take
X = \begin{bmatrix} 1 & 0 \\ 1 & 1 \\ 0 & 1 \end{bmatrix}, \qquad y = \begin{bmatrix} 1 \\ 3 \\ 2 \end{bmatrix},
with the model y = X\beta + \varepsilon and \varepsilon \sim \mathcal{N}(0, \sigma^2 I_3). Conditioning on X and \beta, rung 3 gives the mean and covariance of the response directly,
\mathbb{E}[y] = X\beta, \qquad \operatorname{Cov}(y) = \sigma^2 I_3,
so y \sim \mathcal{N}(X\beta, \sigma^2 I_3). Writing out the log-likelihood of rung 5 for this data,
\ell(\beta, \sigma^2) = -\frac{3}{2}\log(2\pi\sigma^2) - \frac{1}{2\sigma^2}\lVert y - X\beta \rVert^2 ,
the first term is free of \beta, so the entire dependence on \beta sits in -\frac{1}{2\sigma^2}\lVert y - X\beta \rVert^2. Maximizing over \beta means setting the gradient to zero:
\nabla_\beta \ell = \frac{1}{\sigma^2} X^\top(y - X\hat\beta) = 0 \quad\Longleftrightarrow\quad X^\top X\hat\beta = X^\top y ,
the normal equations. The two ingredients are short to assemble by hand. The Gram matrix is
X^\top X = \begin{bmatrix} 1 & 1 & 0 \\ 0 & 1 & 1 \end{bmatrix}\begin{bmatrix} 1 & 0 \\ 1 & 1 \\ 0 & 1 \end{bmatrix} = \begin{bmatrix} 2 & 1 \\ 1 & 2 \end{bmatrix},
and the right-hand side is
X^\top y = \begin{bmatrix} 1 & 1 & 0 \\ 0 & 1 & 1 \end{bmatrix}\begin{bmatrix} 1 \\ 3 \\ 2 \end{bmatrix} = \begin{bmatrix} 4 \\ 5 \end{bmatrix}.
The system \begin{bmatrix} 2 & 1 \\ 1 & 2 \end{bmatrix}\hat\beta = \begin{bmatrix} 4 \\ 5 \end{bmatrix} has determinant 2\cdot 2 - 1\cdot 1 = 3, so
\hat\beta = \frac{1}{3}\begin{bmatrix} 2 & -1 \\ -1 & 2 \end{bmatrix}\begin{bmatrix} 4 \\ 5 \end{bmatrix} = \frac{1}{3}\begin{bmatrix} 8 - 5 \\ -4 + 10 \end{bmatrix} = \frac{1}{3}\begin{bmatrix} 3 \\ 6 \end{bmatrix} = \begin{bmatrix} 1 \\ 2 \end{bmatrix}.
Notice that the noise scale \sigma^2 cancelled the moment we set \nabla_\beta\ell = 0: the positive factor 1/\sigma^2 multiplies the whole gradient and so plays no role in locating its zero. The estimate \hat\beta = (1, 2)^\top is exactly the vector Chapter 2 obtained by minimizing the loss \lVert y - X\beta \rVert^2 — here it falls out of maximizing a Gaussian likelihood instead. Maximum likelihood and least squares are not analogous, they are the same computation on this data.
Example: how fast does an estimate sharpen?
Suppose we observe n i.i.d. weekly readings X_1, \dots, X_n of some quantity — a baseline conversion rate, say — each with unknown mean \mu and known variance \sigma^2, and we estimate \mu by the sample mean \bar X_n. From rung 6, the mean is unbiased, \mathbb{E}[\bar X_n] = \mu, and because the readings are independent their variances add:
\operatorname{Var}(\bar X_n) = \frac{1}{n^2}\sum_{i=1}^n \operatorname{Var}(X_i) = \frac{n\sigma^2}{n^2} = \frac{\sigma^2}{n}.
The standard error is the standard deviation of the estimator, \operatorname{SE}(\bar X_n) = \sigma/\sqrt{n}. With \sigma = 2 this gives a concrete schedule of precision:
n = 4:\ \operatorname{SE} = 1, \qquad n = 16:\ \operatorname{SE} = 0.5, \qquad n = 64:\ \operatorname{SE} = 0.25 .
Each step quadruples n, which quarters the variance and so halves the standard error — the \sqrt{n} law in numbers. The CLT of rung 6 adds the shape — \bar X_n is approximately \mathcal{N}(\mu, \sigma^2/n) for large n, so these standard errors translate directly into confidence statements about \mu. The same \sqrt{n} shrinkage governs the regression estimate: with sampling covariance \sigma^2(X^\top X)^{-1} and roughly X^\top X \propto n as weeks accrue, \hat\beta sharpens at the identical rate, so doubling our precision on a media effect costs four times the data.
Exercises
C – Conceptual / Reading Comprehension
C1. The model assumes \operatorname{Cov}(y) = \sigma^2 I. In plain words, explain what this asserts about the weeks of data. Address both pieces separately: (a) what the equal diagonal entries \sigma^2 say about the noise across different weeks, and (b) what the zero off-diagonal entries say about the relationship between the errors in any two distinct weeks.
C2. The chapter shows that the OLS estimator \hat\beta = (X^\top X)^{-1} X^\top y is exactly the maximum-likelihood estimator under the Gaussian model \varepsilon \sim \mathcal N(0, \sigma^2 I). Chapter 1 already derived \hat\beta as an orthogonal projection of y onto the column space of X. What does the MLE equivalence let you say about \hat\beta — for instance about its sampling distribution, uncertainty, or optimality — that the projection geometry alone could not?
C3. Suppose you have computed both a single MLE point estimate \hat\beta and a full posterior distribution p(\beta \mid y). What does the posterior give a decision-maker that the point estimate does not? Frame your answer in terms of what a media-mix manager could do with the posterior when deciding how much to trust a channel’s estimated effect.
B – By Hand
B1. Let w be a random vector with
\operatorname{Cov}(w) = \begin{bmatrix} 2 & 1 \\ 1 & 2 \end{bmatrix},
\qquad
A = \begin{bmatrix} 1 & 1 \\ 1 & -1 \end{bmatrix}.
Compute \operatorname{Cov}(Aw) explicitly, showing the matrix product A \operatorname{Cov}(w) A^\top.
B2. Write down the bivariate-normal density p(x) for x \in \mathbb{R}^2 with mean \mu = 0 and covariance
\Sigma = \begin{bmatrix} 1 & 0.5 \\ 0.5 & 1 \end{bmatrix}.
Give \det \Sigma and \Sigma^{-1} explicitly, then substitute them into the general form p(x) = (2\pi)^{-1} (\det\Sigma)^{-1/2} \exp\!\big(-\tfrac12 x^\top \Sigma^{-1} x\big).
B3. A given week is “high season” with prior probability \Pr(H) = 0.3. A sales spike occurs with probability 0.8 in a high-season week and probability 0.2 otherwise. You observe a spike. Use Bayes’ rule to compute the posterior probability \Pr(H \mid \text{spike}).
P – Prove It
P1. Let w be a random vector with covariance \operatorname{Cov}(w) = \Sigma, let A be a fixed (non-random) matrix, and let b be a fixed vector. Prove that
\operatorname{Cov}(Aw + b) = A\,\operatorname{Cov}(w)\,A^\top.
Start from the definition \operatorname{Cov}(z) = \mathbb{E}\big[(z - \mathbb{E}[z])(z - \mathbb{E}[z])^\top\big].
P2. Let y \sim \mathcal N(X\beta, \sigma^2 I) with X of full column rank. Write the log-likelihood \ell(\beta), and prove that the maximum-likelihood estimate \hat\beta satisfies the normal equations
X^\top X \hat\beta = X^\top y.
Comment on why full column rank guarantees a unique solution.
P3. Let X_1, \dots, X_n be i.i.d. with mean \mu and finite variance \sigma^2, and let \bar X_n = \tfrac1n \sum_{i=1}^n X_i. Using Chebyshev’s inequality, prove the weak law of large numbers: for every \epsilon > 0,
\Pr\!\big(|\bar X_n - \mu| \ge \epsilon\big) \to 0 \quad \text{as } n \to \infty.
A – Applied / Code
A1. Monte-Carlo the sampling distribution of OLS. Fix a design matrix X (say n = 50 rows, p = 3 columns) and true coefficients \beta_{\text{true}}. For B replications (e.g. B = 10{,}000), simulate y = X\beta_{\text{true}} + \varepsilon with \varepsilon \sim \mathcal N(0, \sigma^2 I), compute \hat\beta = (X^\top X)^{-1} X^\top y, and store it. Then compare the empirical covariance of the stored \hat\beta vectors against the theoretical \sigma^2 (X^\top X)^{-1}. Report the largest absolute entrywise discrepancy between the two matrices and confirm that it shrinks as B grows.
A2. A CLT experiment. For each sample size n \in \{1, 5, 30, 200\}, repeatedly (e.g. 10{,}000 times) draw a sample of size n from a strongly non-normal distribution — for instance an Exponential — and record the sample mean \bar X_n. Standardize each recorded mean by subtracting the true mean and dividing by \sigma/\sqrt{n}, then histogram the standardized means for each n on a common axis. Describe how the histograms change shape as n grows and how they approach a standard Gaussian \mathcal N(0, 1).